Thursday, 14 April 2011
Wednesday, 13 April 2011
Insulation Coordination
Insulation coordination comprises the selection of the electric strength of equipment in relation to the voltages which can appear on the system for which the equipment is intended. The overall aim is to reduce to an economically and operationally acceptable level the cost and disturbance caused by insulation failure and resulting system outages.
To keep interruptions to a minimum, the insulation of the various parts of the systems must be so graded that flashover only occur at intended points. With increasing system voltage, the need to be reduces the amount of insulation in the system by proper coordination of the insulating levels become more critical.
Terminology Insulation Coordination
1. Nominal System Voltage: It is the r.m.s. phase-to-phase voltage by which a system is designated.
2. Maximum System Voltage: It is the maximum rise of the r.m.s. phase-to-phase system voltage.
3. Factor of Earthing: This is the ration of the highest r.m.s. phase-to-earth power frequency voltage on a sound phase during an earth fault to the r.m.s. phase-to-phase power frequency voltage which would be obtained at the selection location without the fault.
4. Effectively Earthed System: A system is said to be effectively earthed if the factor of earthing does not exceed 80% and non-effectively earthed if it does.
5. Insulation Level: For equipment rated at less than 300kV, it is a statement of the lighting impulse withstand voltage and the short duration power frequency withstand voltage. For equipment rated at greater than 300kV, it is statement of the switching impulse withstand voltage and the power frequency withstand voltage.
6. Conventional Impulse withstand Voltages: This is the peak value of the switching or lighting impulse test voltage at which insulation shall not show any disruptive discharge when subjected to a specified number of applications of this impulse under specified conditions.
7. Conventional Maximum Impulse Voltage: This is peak value of the switching and lighting overvoltage which is adopted as the maximum overvoltage in the conventional procedure of insulation coordination.
8. Statistical Impulse withstand Voltage: This is the peak value of a switching or lighting impulse test voltage at which insulation exhibits, under the specified conditions a 90% probability of withstand. In practice, there is no 100% probability of withstand voltage. Thus the value chosen is that which has a 10% probability of breakdown. As shows in figure 30 below

Figure 30 Statistical Impulse withstand Voltage
9. Statistical Impulse Voltage: This is the switching or lighting overvoltage applied to equipment as a result of an event of one specific type on the system (line energising, reclosing, fault occurrence, lighting discharge, etc), the peak value of which has a 2% probability of being exceeded. As shows in figure 31 below

Figure 31 Statistical Impulse Voltage
10. Rated Short Duration Power Frequency withstand Voltage: This is the prescribed r.m.s. value of sinusoidal power frequency voltage that the equipment shall withstand during tests made under specified conditions and for a specified time, usually not exceeding one minute.
11. Protective Level of Protective Device: These are the highest peak voltage value which should not be exceeded at the terminals of a protective device when switching impulses and lighting impulses of standard shape and rate values are applied under specified conditions.
Solid insulation and breakdown
A good dielectric should have low dielectric loss, high mechanical strength, should be free from gaseous inclusions and moisture, resistant to thermal and chemical deterioration. Solid dielectrics have higher breakdown strength compared to liquids and gases. The mechanism of breakdown is a complex phenomena in the case of solid and varies depending on the time of application of voltage, as figure 24 below

Figure 24 Variation of breakdown strength with time after application of voltage
The variation of breakdown mechanisms can be classified as follows1. Intrinsic or ionic breakdown
2. Electromechanical breakdown
3. Failure due to treeing and tracking
4. Thermal breakdown
5. Electrochemical breakdown
6. Breakdown due to internal discharges
Electromechanical breakdown
When an electric field is applied to a dielectric between two electrodes, a mechanical force will be exerted on the dielectric due to the force of attraction between the surface charges. This compression decreases the dielectric thickness thus increasing the effective stress. As shown in figure 25 below

Figure 25 Process of breakdown
Compressive force Pc = ½ D E = ½ ɛo ɛr V2/d2, and From Hooke's Law for large strains, Pc = Y ln (do/d)
At equilibrium, equating forces gives the equation,

By differentiating with respect to d, it is seen that the system becomes unstable when ln (do/d) > ½ or d < 0.6 do.
Thus, when the field is increased which the thickness of the material will decreases. At the field when d < 0.6 do, any further increase in the field would cause the mechanical collapse of the dielectric. The apparent stress (V/do) at which this collapse occurs is thus given by the equation.

Breakdown due to internal discharges
Solid insulating materials sometimes contain voids or cavities in the medium or boundaries between the dielectric and the electrodes. These voids have a dielectric constant of unity and a lower dielectric strength. Hence the electric field strength in the voids is higher than that across the dielectric. Thus even under normal working voltages, the field in the voids may exceed their breakdown value and breakdown may occur. The mechanism can be explained by considering the following equivalent circuit of the dielectric with the void, shown in figure 26 below

Figure 26 Equivalent circuit of dielectric with void
When the voltage Vv across the void exceeds the critical voltage Vc, a discharge is initiated and the voltage collapses. The discharge extinguishes very rapidly (say 0.1 µs). The voltage across the void again builds up and the discharges recur. The number and frequency of the discharges will depend on the applied voltage. The voltage and current waveforms (exaggerated for clarity) are shown in figure 27 below

Figure 27 Internal discharges
In each of the discharges, there will be heat dissipated in the voids which will cause carbonization of the surface of the voids and erosion of the material. The gradual erosion of the material and consequent reduction in the thickness of the insulating material eventually leads to breakdown.
Breakdown by this process is slow and may occur in a few days or may take a few years.
Surface breakdown
Surface flashover is a breakdown of the medium in which the solid is immersed. The role of the solid dielectric is only to distort the field so that the electric strength of the gas is exceeded.
If a piece of solid insulation is inserted in a gas so that the solid surface is perpendicular to the equipotentials at all points, then the voltage gradient is not affected by the solid insulation. An example of this is a cylindrical insulator placed in the direction of a uniform field. Field intensification results if solid insulation departs even in detail from the cylindrical shape. In particular if the edges are chipped, or if the ends of the cylinder are not quite perpendicular to the axis, then an air gap exists next to the electrode, and the stress can reach up to ɛr times the mean stress in the gap. [ɛr is the dielectric constant of the cylinder]. Discharge may therefore occur at a voltage approaching 1/ɛr times the breakdown voltage in the absence of the cylinder, and these discharges can precipitate a breakdown.
The three essential components of the surface flashover phenomena are
(a) The presence of a conducting film across the surface of the insulation
(b) A mechanism whereby the leakage current through the conducting film is interrupted with the production of sparks,
(c) Degradation of the insulation must be caused by the sparks.
Tracking is the formation of a permanent conducting path across a surface of the insulation, and in most cases the conduction (carbon path) results from degradation of the insulation itself leading to a bridge between the electrodes. The insulating material must be organic in nature for tracking to occur.
In a surface discharge, if the products of decomposition are volatile and there is no residual conducting carbon on the surface, the process is simply one of pitting. This is erosion, which again occurs in organic materials.
If surface discharges are likely to occur, it is preferable to use materials with erosion properties rather than tracking properties, as tracking makes insulation immediately completely ineffective, whereas erosion only weakens the material but allows operation until replacement can be made later.
Thermal breakdown
Heat is generated continuously in electrically stressed insulation by dielectric losses, which is transferred to the surrounding medium by conduction through the solid dielectric and by radiation from its outer surfaces. If the heat generated exceeded the heat lost to the surroundings, the temperature of the insulation increases.
In practice, although the heat lost may be considered somewhat linear, the heat generated increases rapidly with temperature, and at certain values of electric field no stable state exists where the heat lost is equal to the heat generated so that the material breaks down thermally. The rapid increase is due to the fact that with rise in temperature, the loss angle of the dielectric increases in accordance with an exponential law (loss α e-A/T, where T is the absolute temperature).

Figure 28 Thermal breakdown
Figure 28 above shows the variation of heat generated by a device for 2 different applied fields and the heat lost from the device with temperature.
For the field E2, a stable temperature θA exists (provided the temperature is not allowed to reach θB). For the field E1, the heat generated is always greater than the heat lost so that the temperature would keep increasing until breakdown occurs.
The maximum voltage a given insulating material can withstand cannot be increased indefinitely simply by increasing its thickness. Owing to thermal effects, there is an upper limit of voltage Vθ, beyond which it is not possible to go without thermal instability. This is because with thick insulation, the internal temperature is little affected by the surface conditions. Usually, in the practical use of insulating materials, Vθ is a limiting factor only for high-temperature operation, or at high frequency failures.
Electrochemical breakdown
Since no insulation is completely free of ions, a leakage current will flow when an electric field is applied. The ions may arise from dissociation of impurities or from slight ionisations of the insulating material itself. When these ions reach the electrodes, reactions occur in accordance with Faraday's law of electrolysis, but on a much smaller scale. The insulation and the electrode metal may be attacked, gas may be evolved or substance may be deposited on the electrodes. The products of the electrode reaction may be chemically or electrically harmful and in some cases can lead to rapid failure of the insulation. The reactions are much slower than in normal electrolytic processes due to the much smaller currents. The products of the reactions may be electrically and chemically harmful because the insulation and electrodes may be attacked, and because harmful gases may be evolved.
The rate of electrolysis is much greater with direct stress than with alternating stress. This is due to the fact that the reactions may be wholly or partially reversed when the polarity changes and the extent of reaction depends on the reaction rate and the time for diffusion of the reaction products away from the electrodes as well as on the nature of the reaction products. However at power frequency, electrochemical effects can be serious and are often responsible for long-term failure of insulation. The most frequent source of ions is ionizable impurities in the insulation. Thus contamination of insulation during manufacture and during assembly into equipment must be avoided with great care.
Also, contamination in polar insulating materials should be avoided with still greater care because of the greater degree of dissociation of ionic substance in solution.
The long term lives of capacitors containing chlorinated impregnants under direct stress may be greatly extended by adding small quantities of certain stabilizers, which are hydrogen acceptors and act as depolarizers at the cathode.
Hydrogen ions discharged at the cathode readily react with the stabilizer rather than with the impregnant, a more difficult chemical process. In the absence of the stabilizer, the hydrogen reacts with the chlorine of the impregnant to produce hydrochloric acid, and rapid deterioration occurs due to attack of the acid on the electrodes and cellulose. The extension of the life caused by the stabilizers is proportional to the amount of stabilizer added. For example, with 2% of the stabilizer Azobenzene, mean life may be extended 50 times.
Chemical Deterioration
Progressive chemical degradation of insulating materials can occur in the absence of electric stress from a number of causes.
Chemical Instability
Many insulating materials, especially organic materials, show chemical instability. Such chemical changes may result from spontaneous breakdown of the structure of the material. Under normal operating conditions, this process is very slow, but the process is strongly temperature dependant. The logarithm of the life t of paper insulation can be expressed as an inverse function of the absolute temperature θ. Log10 t = A/θ + B where A & B are constants.
Oxidation
In the presence of air or oxygen, especially ozone, materials such as rubber and polyethylene undergo oxidation giving rise to surface cracks, particularly if stretched and exposed to light. Polythene also oxidises in strong day light unless protected by an opaque filler.
Hydrolysis
When moisture or water vapour is present on the surface of a solid dielectric, hydrolysis occurs and the materials lose their electrical and mechanical properties. Electrical properties of materials such as paper, cotton tape, and other cellulose materials deteriorate very rapidly due to hydrolysis. Polyethylene film may lose its mechanical strength in a few days if kept at 100 % relative humidity.
Other processes
Progressive chemical degradation of insulating materials can also occur due to a variety of processes such as, incompatibility of materials (ex: rubber ages more rapidly at elevated temperatures in the presence of copper, and cellulose degrades much more rapidly in the presence of traces of acidic substances), and leaching (washing out of a soluble constituent) of chemically active substances (ex: glass fabrics made from glasses of high sodium content lose their strength rapidly due to leaching of sodium to the surface of the fibres and the subsequent chemical attack of the strong alkali on the glass surface).
Cited from the research papers, base on the figure 29 below
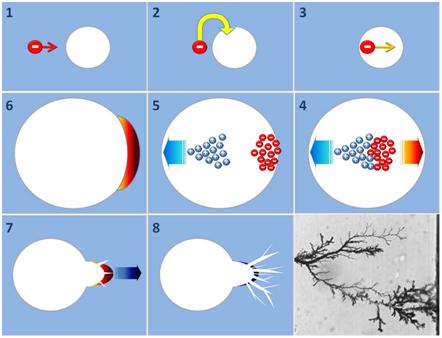
Figure 29 Illustration of void-to-free transition
As the figure 29 above, shows that illustrates the void-to-free transition. Conduction a carriers (electrons) can be penetrate the void either through the ionization of gas in the void or by de-trapping from loose chain ends. Electron production is accelerated by the intensive electric field within the void following the development of electron avalanche. The electric field further divides electrons and positive ions and the electron cloud strikes the wall of the void.
In the meantime, positive ions drift to the opposite side. The wall is eventually damaged as a result of either carbonization or ohmic heating or both. After the elapse of time, the carbonized area shapes a new void. As new void is considerably smaller than the original, the electric field within the new void is stronger than before, ultimately giving birth to electrical treeing.
Liquid Insulation and Breakdown
Liquids and solids are usually 103 times denser than gases and from Paschen’s law it should follow that they possess much higher dielectric strength of the order by 107 V/cm. It filled the complete volume to be insulated and simultaneously will dissipate heat by convection. Oil is about 10 times more efficient than air or nitrogen in its heat transfer capability when in used. It expected to give very high dielectric strength if the order of 10 MV/cm. Normal, are mixtures of hydrocarbon and weakly polarised. The most important factor that affects the electrical strength of insulating oil is the presence of water in the form of fine droplets suspended in the oil.
The electrical properties that essential in determining the dielectric performance of a liquid dielectric are
1. Capacitance per unit volume or its relative permittivity
2. Resistivity
3. Loss tangent (tan δ) or its power factor which is an indication of the power loss under AC voltage application
4. Ability to withstand high electric stresses

Figure 17 Liquid purification system test cell
Figure 17 above shows the liquid breakdown test, the electrodes used for breakdown voltage measurements are usually spheres of 0.5 to 1 cm in diameter with gap spacing of about 100 to 200 µm. The gap is accurately controlled by using a micrometer. Electrode separation is very critical in measurements with liquids and also the electrode surface smoothness and the presence of oxide films have a marked influence on the breakdown strength. The test voltage required for these test are usually low (50 to 100kV), cause of small electrode spacing. The breakdown strength and DC conductivities obtained in pure liquids are very high (order of 1MV.cm and 10-18 to 10-20 ohm/cm respectively. The conductivity being measured at electric fields (order of 1kV/cm). Below figure 18 and 19 shows different types of conduction current-electric field characteristics of liquids

Figure 18 Conduction current-electric field characteristics in hexane at high fields

Figure 19 Conduction current-electric field characteristics in a hydrocarbon liquid
Figure 20 below shows, the maximum breakdown strengths of some highly purified liquids and liquefied gases

Figure 20 Maximum breakdown strengths of some liquids
Equivalent circuit of liquids partial discharge

Figure 21 Equivalent circuit of partial discharge in oil
Above figure 21, the equivalent circuit for streamer discharge, insulating liquid is represented as capacitances. The streamer is represented by capacitance Ca in parallel with a spark gap. Cb is represented capacitance of the sound of the insulation while the rest of the sample is represented by Cm. As the voltage is applied to the streamer before any discharge taken place is

Therefore, the magnitude for the first discharge can be expressed as

Use simulation software, by running the partial discharge of streamer in liquids insulation and breakdown. This is to generating partial discharge pulses and visualization of partial discharge patters and their pulses sequence. Include ϕ-q-n graph, ϕ-q graph for five consecutive cycle and ϕ-n graph. Figure 22 shows two different simulations that had been simulated below


Figure 22 Typical ϕ-q-n pattern (a), pulse sequences (b) and ϕ-n (c) partial discharge in oil/liquid under sinusoidal and triangular voltage
The prerequisites for positive half cycle are
1. Applied voltage should higher than positive inception voltage.
2. Determine factor representing appearance of early electron should higher than positive threshold.
The prerequisites for negative half cycle are
1. Applied voltage should lower than negative inception voltage.
2. Probability representing appearance of early electron should lower than maximum allowed probability.
The considered liquids to be analyze are mineral oils (MO1/A, MO3/C and MO4/B), synthetic ester (SE1/E) and natural esters (VO1/G, VO2/F, VO3/E, VO4/H). Those oils are treated (filtration under vacuum) even if the influence of particle and humidity is negligible under impulse voltage with point-plane arrangement. Below figure 23 experiment done under impulse voltage of positive and negative with point-plane


Figure 23 Negative streamer samples observed in negative polarity (left) and Positive streamer samples observed in positive polarity (right)
Wednesday, 30 March 2011
Gas/Vacuum Insulation and Breakdown
Gas insulation is the most common of the air at atmospheric pressure. Gases are commonly found in dielectric insulating medium, such as Nitrogen (N2), Carbon dioxide (CO2), Freon (CCI2F2) and Sulphur Hexafluoride (SF6).
By applying, low voltage and small amount of current flow, the electrodes and insulation retain its electrical properties. Then by applying, high voltage and large amount of current flow, the insulation increases sharply and an electrical breakdown occurs.

Figure 1 Current-Voltage relationship in breakdown region
Figure 1 above, is the gases of dielectric breakdown as in current and voltage non-linear relationship. As in region 1, a small amount of current can be induced ohmically. In region 2, It is then brought to a state of saturation. In region 3, by continue increase the voltage as a result in rise of current an exponential manner, although the current density is still insufficient to cause complete dielectric breakdown. In region 4, as an observed of photoionization, finally the electron avalanche evolves forming a plasma channel (at the tip), which will convert the material into a conductor. Here, the electrical discharges have two types, such as non-sustaining discharges and self-sustaining discharges. The spark breakdown is the transition of a non-sustaining discharge into a self-sustaining discharge.
In Townsend’s current growth equation, let α be average number of ionizing collisions made by an electron per centimetre travel in the direction of the field (α depends on gas pressure p and E/p and is called the Townsend’s first ionization coefficient).

Figure 2 Ionization of the Townsend’s method
From the figure 2 above, at any distance x from the cathode, the number of electrons be nx. Electrons nx travel a further distance of dx will rise to (αnxdx) electrons.

The secondary ionization coefficient γ is define in the same way as α, whereas the net number of secondary electrons produced per incident positive ion, photon, excited particle or metastable particle and total value of γ is the sum of the individual coefficients due to three different processes. It is a function of gas pressure p and E/p.
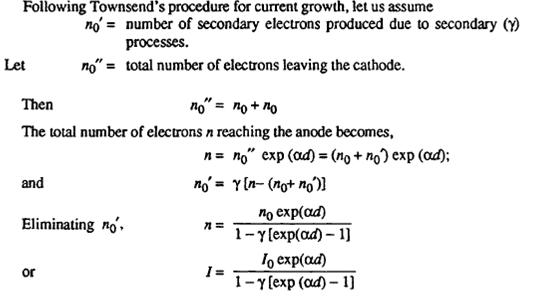
As in Townsend’s breakdown criterion, is the total average current in the gap before occurrence of breakdown. Distance between the electrondes d is increased, the denominator of the equation tends to zero and at some critical distance d = ds.

For values of d < ds, I is approximately equal to Io and if the external source for the supply of Io is removed, I become zero. If d = ds, I à α and the current will be limited only by the resistance of the power supply and the external circuit. The Townsend’s breakdown criterion as below

Normally, exp (α d) is very large and hence reduced the above equation

For given a gap spacing and at a pressure, the value of the voltage V which gives the value of α and γ satisfying the breakdown criterion is called the spark breakdown voltage Vs and the corresponding distance ds is called the sparking distance.
Streamer theory in breakdown gases is a very fast and positive space change extends to the cathode very rapidly resulting in the formation of a streamer. Comparatively narrow lumimous tracks occurring at breakdown at high pressures. As soon as the streamer tip approaches the cathode, a cathode spot is formed and a streams of electrons rush form the cathode to neutralize the positive space charge in the streamer, which result a spark and spark breakdown has occurred. As shown in figure 3 and 4 diagrams below

Figure 3 Effect of space charge produced by an avalanche on the applied electric field

Figure 4 Cathode directed streamer
In figure 4 above, which (a) shows the stage when avalanche has crossing the gap, (b) shows that the streamer has crossed half the gap length and (c) shows that the gap has been bridged by a conducting channel.
Paschen’s law that the breakdown criterion in gases as given equation below
Where the coefficients α and γ are functions of E/p,

Substituting for E in the equation above for α and γ, as rewrite equation below

Below shows the breakdown clearances at high frequency as in figure 5

Figure 5 Formation of corona in large clearances at high frequencies. EC denotes the critical field strength (corona inception)
The breakdown voltages (Ub) of clearances (range between 0.5 mm to 4.0 mm) are frequency dependent, as in figure 6 below shows

Figure 6 Breakdown at high frequency in air at atmospheric pressure, homogeneous field, frequency range 50 Hz to 25 MHz
The vacuum can be classified as
High vacuum : 1 x 10⁻³ to 1 x 10⁻⁶ Torr
Very High vacuum : 1 x 10⁻⁶ to 1 x 10⁻⁸ Torr
Ultra High vacuum : 1 x 10⁻⁹ Torr and below
From the research paper samples as below cited,


Figure 7 Field calculation model and analysis result of vacuum interrupter and definition of configuration parameters of center shield

Figure 8 Optimization method of electrode surface
Non-uniform Air gap characteristics in positive streamer propagation and breakdown, shows in figure 9, 10, 11 and 12 below

Figure 9 Experimental setup of the positive streamer propagation

Figure 10 Definition of primary and secondary streamer current and time to Breakdown

Figure 11 Discharge waveforms and images (V = 28kV, g = 15 mm)

Figure 12 Discharge waveform and fast-framing images leading to Breakdown (V = 30kV, g = 15 mm)
Vacuum Insulator analysis of coaxial high voltage insulation at 800kV, as shown in figure 13, 14, 15 and 16 below

Figure 13 Outline of the TPG700 (1) Tesla transformer (PFL), (2) Main switch, (3) Transmission line, (4) Vacuum insulator and (5) Diode

Figure 14 Mechanical drawing of the vacuum insulator (1) Inner conductor, (2) Transformer oil, (3) Anode shield, (4) Insulator, (5) Vacuum, (6) Cathode shield and (7) Outer conductor


Figure 15 E-field magnitude and interface distribution of the vacuum insulator

Figure 16 Schematic illustration of the electric-thermal model
Subscribe to:
Comments (Atom)